How to test from the web UI
How to run a test on your project from the Polaris user interface.
From the Polaris user interface, you can:
- Run SAST and SCA tests using:
- Source code you upload manually. Note: Before uploading, see the limitations for uploads here: Source code upload limitations.
- A branch of a repository. Note: To scan branches in a repository, you need to set up an SCM integration first. For more information, see Connect a Polaris project to a repository in your SCM. Before or after you set up an SCM integration, you can add branches to a project that aren't connected to a repository.
- Source code you upload manually.
- Run External Analysis tests to import SAST and SCA issues captured in third-party tools. Note: You can upload one file (up to 2GB) for each external analysis test. Each file you upload can only include one type of issue data (SAST or SCA). Different file formats are accepted for different third-party tools. See Supported third-party tools for a full list of supported tools, along with accepted file formats for each.
- Run DAST tests on web application and API targets.
Test a SAST & SCA project
Follow these steps to run SAST and/or SCA tests from the Polaris user interface:
-
There's more than one way to start this procedure:
- Go to Portfolio, select an application, click the three-dot
 icon at the end of the project's row, and select New Test.
 - Go to Tests and select New Test.
- Go to Portfolio, select an application, click the three-dot
-
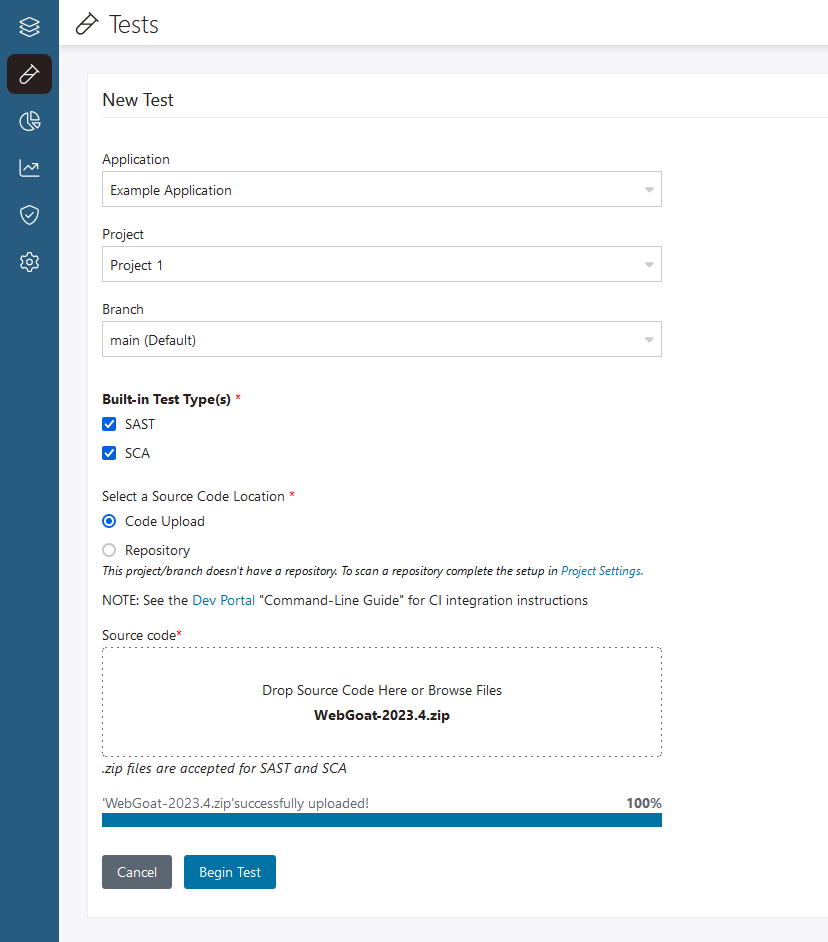
To manually upload code and test it:
-
Select Code Upload.
-
Select Code Upload.
-
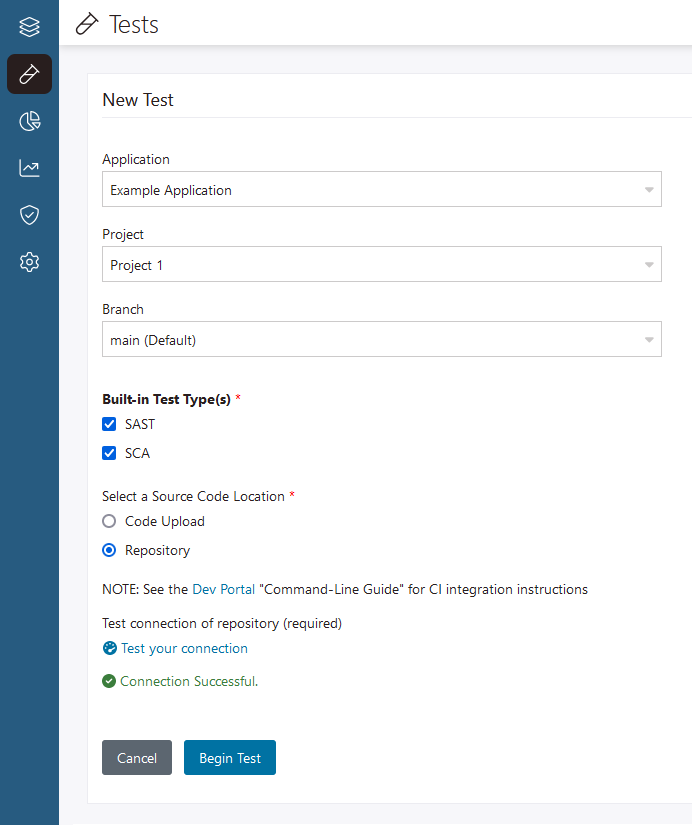
To test a branch in a repository:
-
Select Repository.
Note: The Repository option is only available when you select a branch that is connected to a repository.
-
Select Repository.
-
To import results from a third-party tool:
-
Drag and drop the file you want to import into the Import Results zone, or select Browse Files to find the file to import on your file system.
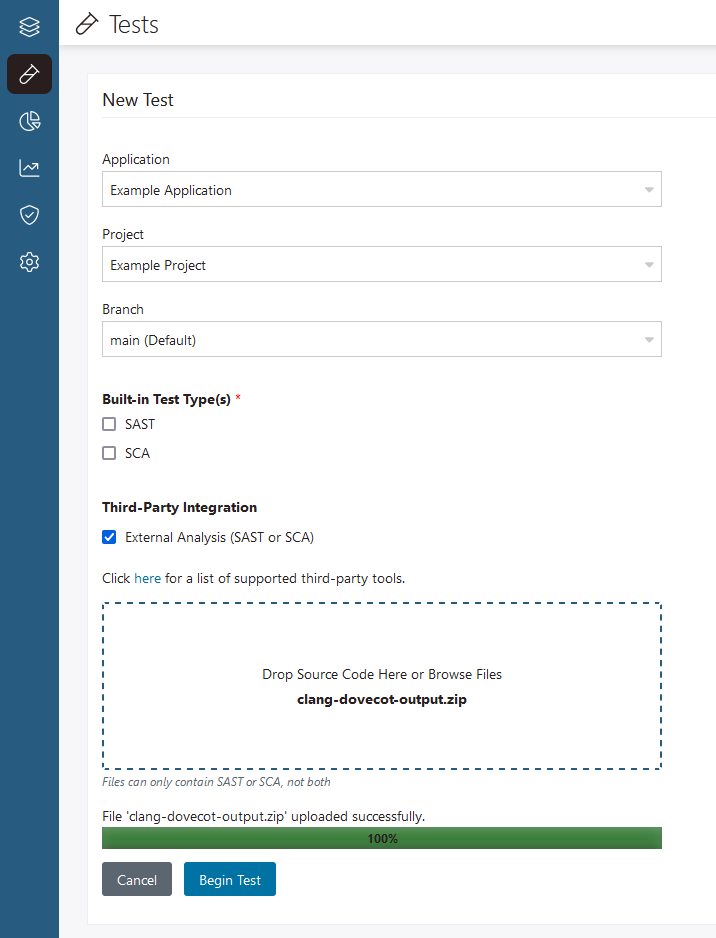
Note: You can upload one file (up to 2GB) for each external analysis test. Each file you upload can only include one type of issue data (SAST or SCA). Different file formats are accepted for different third-party tools. See Supported third-party tools for a full list of supported tools, along with accepted file formats for each.
-
Drag and drop the file you want to import into the Import Results zone, or select Browse Files to find the file to import on your file system.
Test a DAST project
Follow these steps to run a DAST test from the Polaris user interface:
-
There's more than one way to start this procedure:
- Go to Portfolio, select an application, click the three-dot icon at the end of the project's row, and select New Test.
- Go to Portfolio, select an application, select a DAST project, and open the DAST Profiles page. Click the three-dot icon at the end of the profile's row, and select New Test.
- Go to Tests and select New Test.
- Go to Portfolio, select an application, click the three-dot
-
Select the DAST profile to scan with the Application and Project dropdown menus.
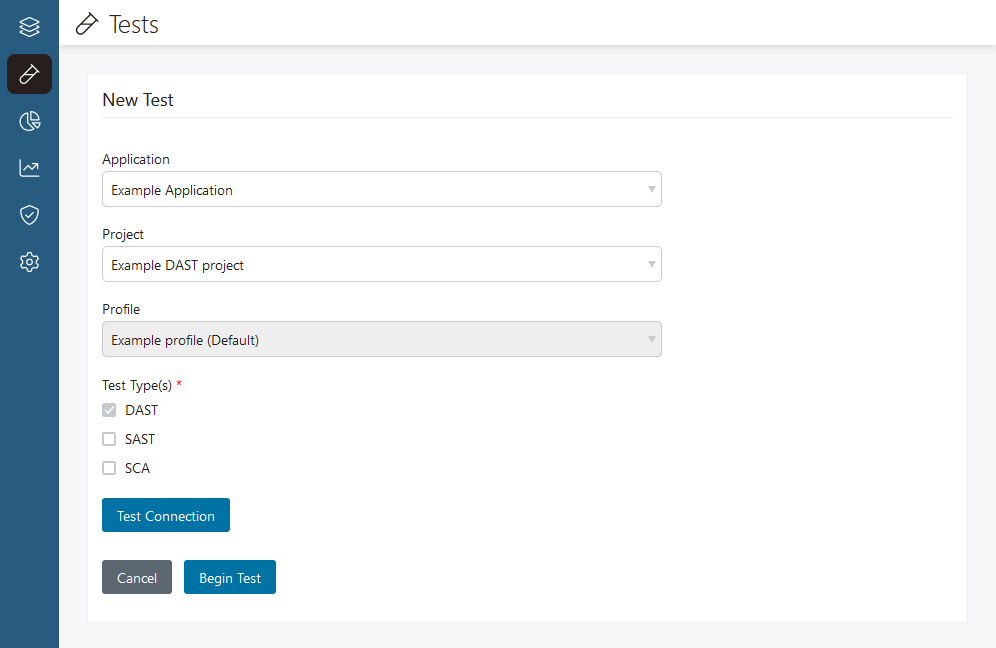
Note: Depending on how you start a test, the Application, Project, and Profile values may already be filled in.
Handling of queued tests
For a specific project and test type, Polaris supports one running (active) test and one queued test at any given time. When both slots are filled, if users start further tests of the same type on the same project, the first (last requested) test is queued and all additional tests are assigned the Not Run status. Tests in Not Run status are not queued and will not be executed. This behavior also applies if tests are requested on different branches of the same project (SAST and SCA tests only).
Example of a test in Not Run status:
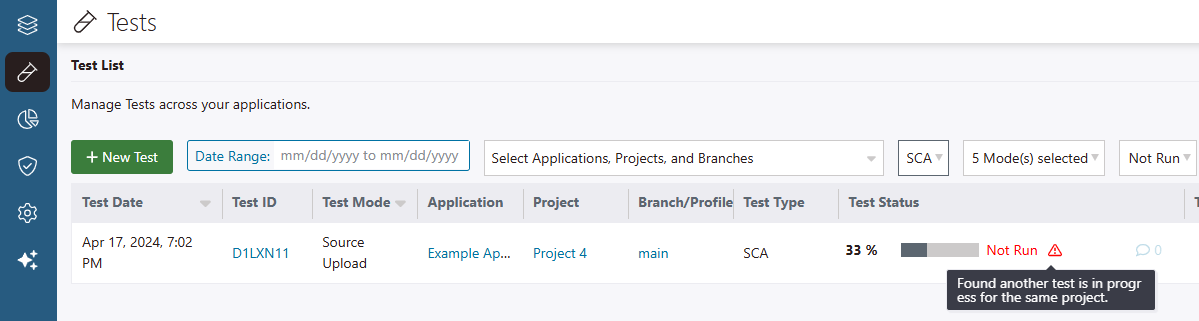
Queued tests example
A test scheduler manages multiple test initiation requests made on the same project. Running once per minute, the test scheduler evaluates all tests in Queuing status for a given project (and its branches, if applicable) and picks which test to execute next. To illustrate how the test scheduler works, consider the following example:
At 10:01, one SCA test is active (running) and one SCA test is queued for project 1. Four other SCA tests have subsequently been requested for project 1; these tests have been placed in the Queuing status.
At 10:02, the test scheduler runs and evaluates the four SCA tests in the queue. Two tests (test 2 and test 3) were requested on the same branch (branch 2):
| SCA test requested (in time order) | Project / branch | Test Status before scheduler runs (10:01) | Test Status after scheduler runs (10:02) |
|---|---|---|---|
| test 1 | project 1 / branch 1 | Queuing | Scanning (picked first) |
| test 2 | project 1 / branch 2 | Queuing | Not Run |
| test 3 | project 1 / branch 2 | Queuing | Scanning (picked second) |
| test 4 | project 1 / branch 3 | Queuing | Scanning (picked third) |
The test scheduler evaluates the four tests as follows:
- Test 1 is picked for execution first—this is the first (most recently requested) test in the queue.
- Test 3 was created after test 2 on the same branch. Therefore, test 2 is assigned to Not Run status.
- Test 3 and test 4 remain in the queue.
- After test 1 completes, test 3 is picked for execution next.
- After test 3 completes, test 4 is picked for execution next.
This scenario assumes that no further tests were requested.