The Portfolio page
The Portfolio page and its sub-pages (The Application page, The Project page) allow you to create and manage applications and projects.
The Portfolio page
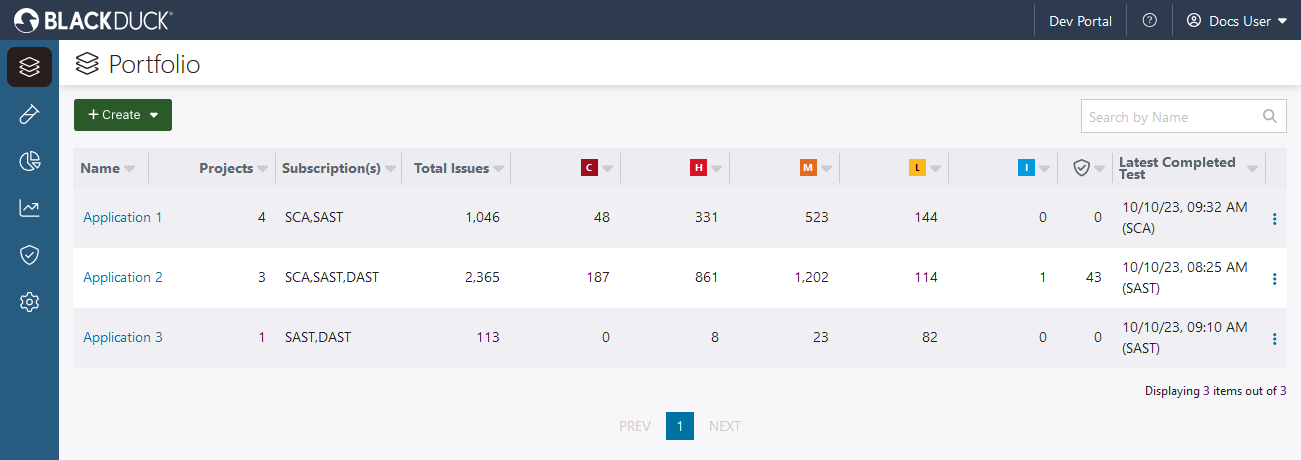
View and manage the applications in your portfolio.
 |
|
| Filter applications by label. In the left panel, select one or
more labels to filter the table to show only applications with the
applied label(s). Note: See Create and manage labels for more information. |
|
| + Create | Create applications:
|
| Search by Name | Search applications by name. |
| Table fields | Lists all applications in your portfolio. For each application,
view:
Note: Issue quantities in the Total Issues and
severity columns do not include dismissed issues (via issue
triage or issues dismissed due to components triaged as
excluded).
Note: Quantities in the Total Active Policy
Violations ( Click an application name to open the Application page
(see "Portfolio Application Page" below). Click on the ellipse icon to select:
|
The Application page
View and manage the projects in an application.
Projects tab
Lists all projects and descriptions in the application.
 |
|
| Filter | Filter projects by label. In the left panel, select one or more labels to filter the table to show only projects with the applied label(s). See Create and manage labels for more information. |
| + Create | Create projects:
|
| Test Type | Filter projects by type. |
| Table fields | View all the projects in your application. For each project,
view:
Note: Issue quantities in the Total Issues
and severity columns do not include dismissed issues (via
issue triage or issues dismissed due to components triaged
as excluded).
Note: Quantities in the Total Active Policy
Violations (
Click a project name or issue quantity to open the Project page (see "Portfolio Project Page" below) and view issues in the Project. When you click an issue quantity in a severity column, only issues matching the severity you select appear on the Project page. Click on the ellipse icon to select:
|
Settings tab
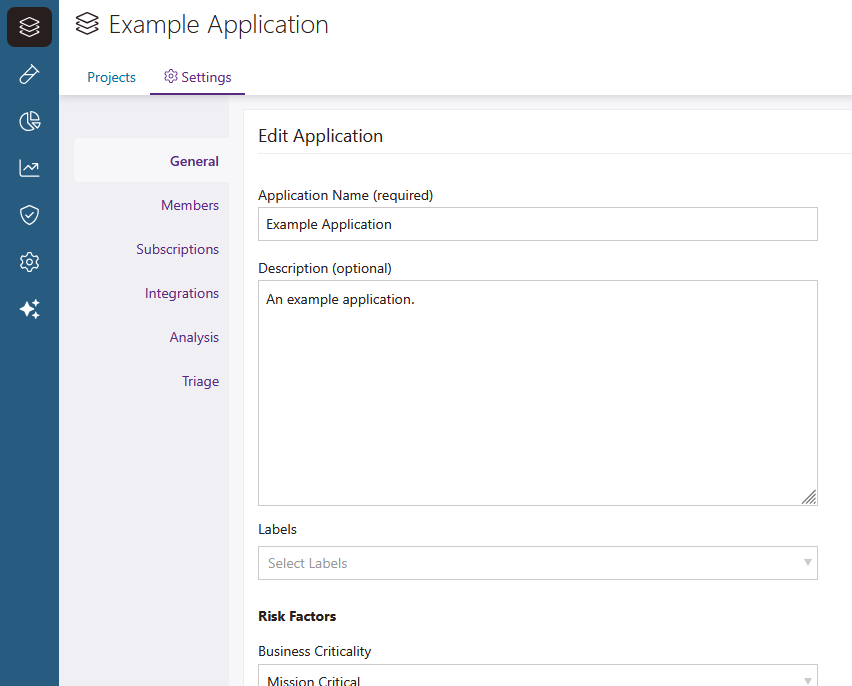
Manage settings for applications.
 |
|
| General | Change the name and description of the application. Apply or remove labels. Change the application's automatic branch deletion setting. |
| Members | Give users or groups access to the application. Control what different users can do with roles. |
| Subscriptions | View Static/SCA subscriptions applied to the application. |
| Integrations | Manage your SCM connections within an application (only available for customers with concurrent subscriptions using GitHub/GitHub Enterprise bulk onboarding). |
| Analysis | Manage an application's file and folder exclusion rules, and customize event-based test automation for your application (if part of an onboarded SCM repositories). See Event-Based Test Automation in Polaris for SCM Integrations for more information. |
| Triage | Manage an application's approval workflow. See Set up triage approval workflows for more information. |
The Project page
Different information appears on the Project page, depending on the type of project (SAST & SCA or DAST) you open.
- SAST & SCA project:
- DAST project:
Branch dropdown
Use the branch dropdown (available while using the Summary, Issues, Components, Licenses, and Tests tabs) to view results for different branches in your project.

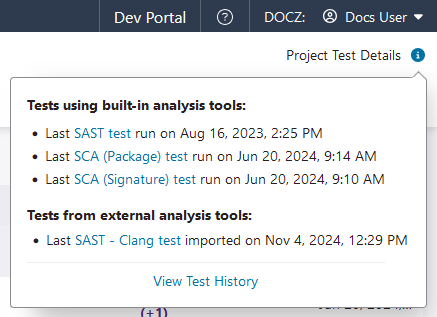
Project Test Details
Select the Project Test Details ![]() icon to view the latest tests run against the project.
icon to view the latest tests run against the project.
Summary tab
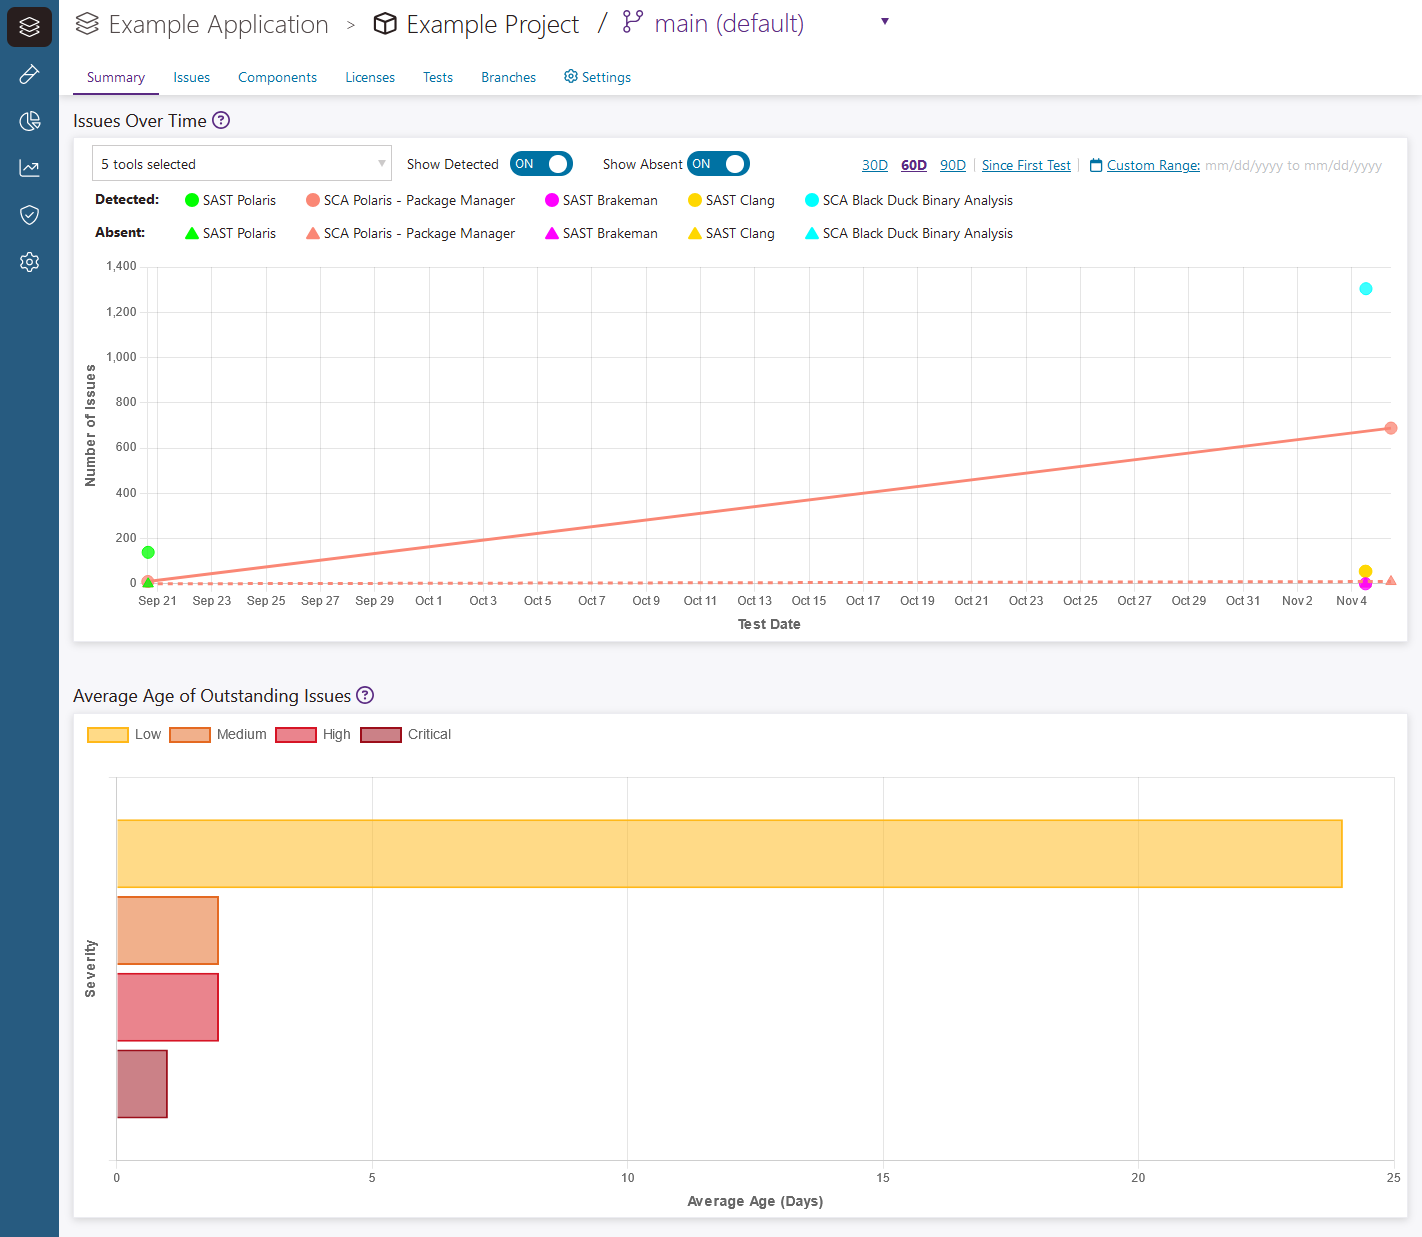
Use the charts on the Summary tab to track the quantity of SAST and SCA issues in a branch over time, and the average age of outstanding (unresolved) issues with different severities.
 |
|
| Issues Over Time | A chart that shows the quantity of detected and absent SAST and SCA issues in each test of a branch over time (by default, 30 days). Includes issues imported from third-party tools, when available.
Note: Issues captured in different SCA tests (package manager or signature analysis) are tracked separately.
Each point on the chart represents a test. Hover over a point to view the test's completed date and time, and the quantity of detected or absent issues. Important: Points on the chart are static and represent completed SAST, SCA, or external analysis tests. A test's detected issue quantity includes all the issues detected in the test, even if the issues were detected in earlier tests and dismissed (via triage). A test's absent issue quantity only includes issues that, after being detected the previous test, are no longer detected. Only the previous test is considered when calculating a test's absent issue quantity. |
| Tool dropdown | Use the Tool dropdown near the upper left corner of the chart to show/hide issues captured with different tools.
Note: Built-in SAST and SCA tools appear at the top of each category. Separate filters appear for each third-party tool you import issues from (using external analysis tests).
|
| Show Detected | Show or hide points on the chart that represent detected issue quantities. |
| Show Absent | Show or hide points on the chart that represent absent issue quantities. |
| Date ranges | Select a date range to narrow the scope of the chart to tests run in a period of time.
|
| Average Age of Outstanding Issues | A chart that shows the average age (in days) of issues in the branch, grouped by severity. Note: Issue age is the time between when an issue is detected (or redetected) and when the issue is no longer detected (absent) or triaged and dismissed. Hover over a bar in the chart to see the value in days. |
| Legend | Select a severity in the legend (below the chart title) to hide/show it. |
Issues tab
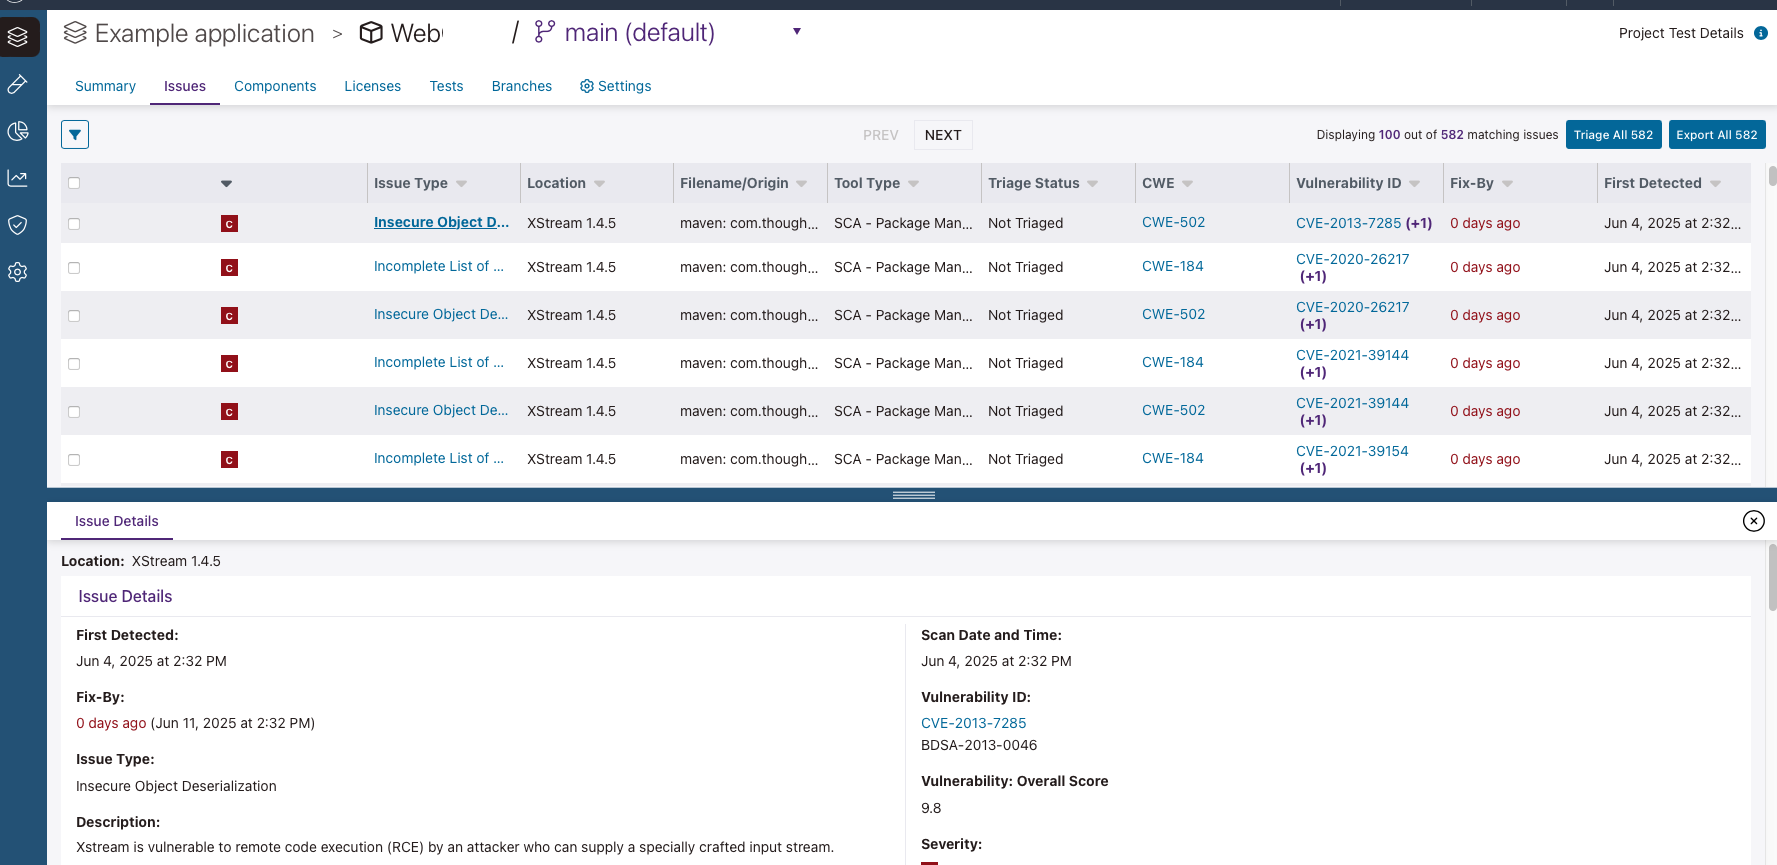
Lists issues in the project.
 |
|
| Clear All | Clear checkbox selections. |
| Triage Selected / Triage All | Triage one, multiple, or all issues. See Ways to triage issues in Polaris for more information. |
| Export Selected / Export all | Export one, multiple, or all issues. See How to export issues to CSV or JSON for more information. |
| Filters panel | Click the filter Important: Polaris automatically deduplicates components so that, when a component is captured in package manager and signature analysis tests of the same branch, it only appears once on the Components tab. However, each issue associated with the component will be listed twice on the Issues tab (or, duplicate issues appear for each component captured in package manager and signature analysis tests of the same branch). Duplicate SCA issues must be triaged separately, but if you triage a component (exclude it from your SBOM), all of the component's issues (including duplicates) are dismissed.
Note: By default, issues captured in both types of SAST and SCA tests appear in the table. Use the Tool Type filter to show issues captured in specific tests.
|
| Table fields | Issue Type: Select an Issue Type name to see Issue Details tab, which includes:
When you select a SAST issue, you can:
For issues captured in DAST tests, you can use the Evidence tab to find more information on attacks. Hover over the policy status |
Components tab
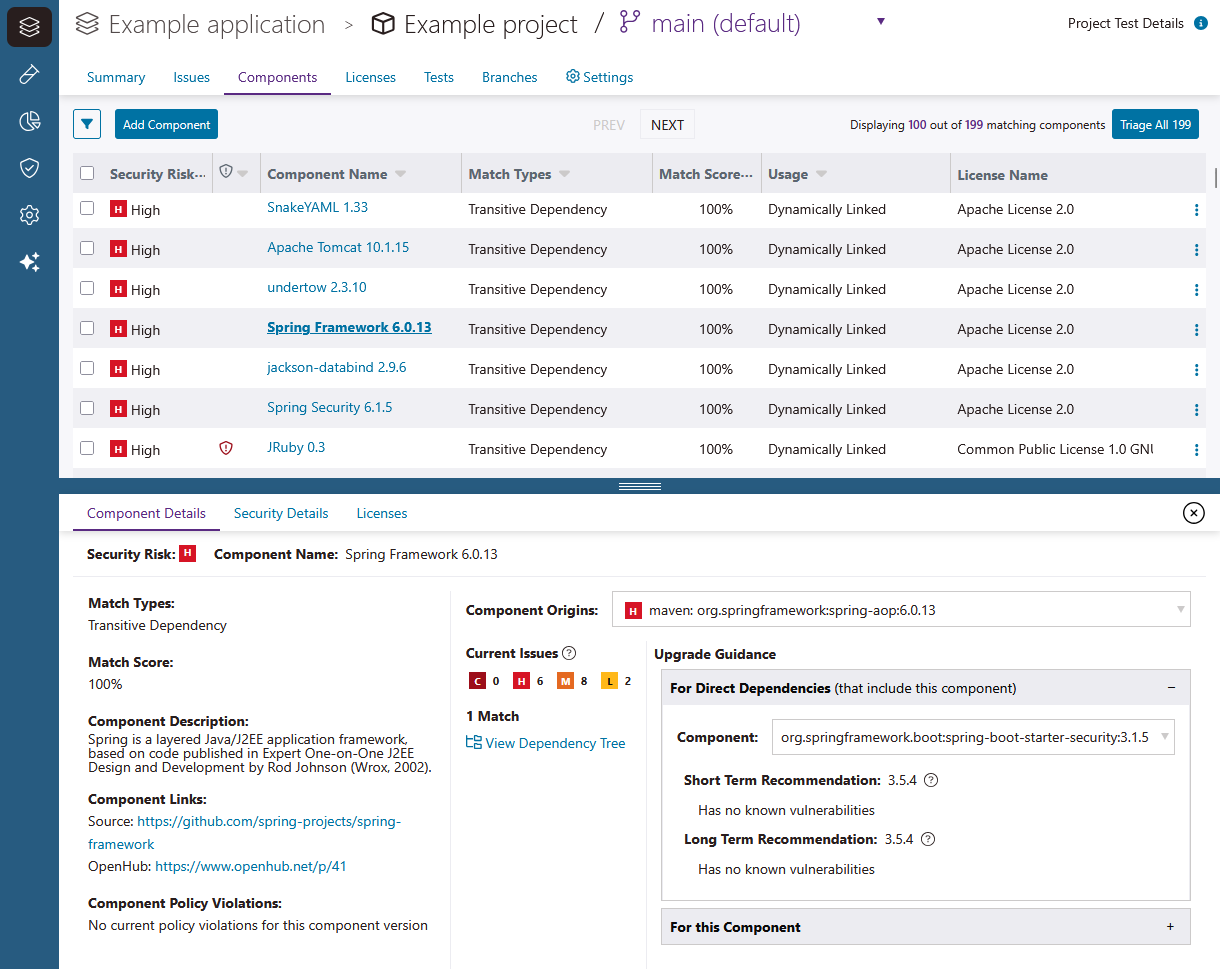
Lists a project's open source components, along with each component's version. Use this bill of materials to identify components that require updates and view upgrade recommendations for direct and transitive dependencies. You can use the branch dropdown (near the top of the page, next to the project name) to view components for different branches in your project.
 |
|
| Filters panel | Click the filter |
| Add Component | Manually add a component to the project. See Add or modify components and Add a component (or component origin) for more information. |
| Clear All | Clear checkbox selections. |
| Triage Selected / Triage All | Triage one, multiple, or all components. See Ways to triage components in Polaris for more information. |
| Table Fields |
For each component, view Security Risk (severity), Policy Violations, Component Name (including version), Match Type, Match Score, Usage, and License Name. Hover over the policy status Important: Polaris automatically deduplicates components so that, when a component is captured in package manager and signature analysis tests of the same branch, it only appears once on the Components tab. However, each issue associated with the component will be listed twice on the Issues tab (or, duplicate issues appear for each component captured in package manager and signature analysis tests of the same branch). Duplicate SCA issues must be triaged separately, but if you triage a component (exclude it from your SBOM), all of the component's issues (including duplicates) are dismissed.
Note: By default, components from both types of SCA tests (package manager and signature analysis) are displayed. Use the Match Type filter to only display components captured in package manager or signature analysis tests.
Each component captured in an SCA test is compared with a copy of the component in the Black Duck KnowledgeBase™ to generate additional metadata. Precise match types (beyond direct and transitive dependencies) and (percentage) match scores are generated for components captured in signature analysis tests. Each component can have multiple match type values. Match types include:
A higher match score indicates a closer match, and a lower match score indicates a component was modified. Precise match scores only appear for components identified in signature analysis tests; the match score for a component identified in a package manager test will always be 100%. Select a component's name to view:
|
Licenses tab
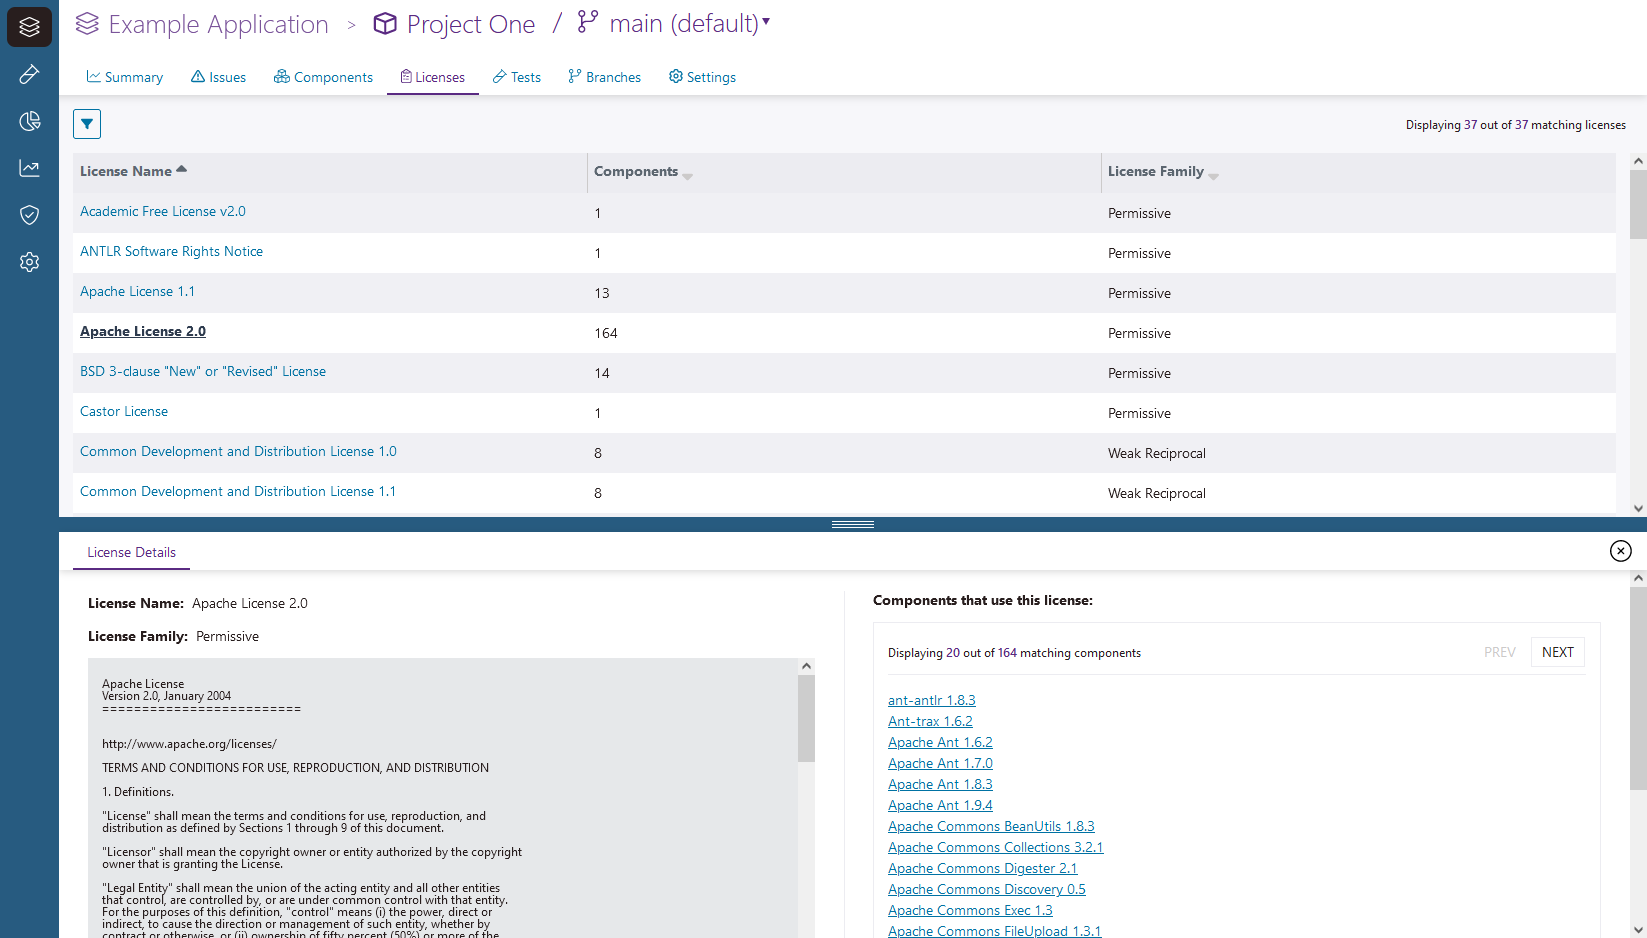
View Licenses for your project. You can use the branch dropdown (near the top of the page, next to the project name) to view licenses for different branches in your project.
 |
|
| Filters panel | Click the filter |
| Table Fields |
A list of your project's applicable licenses, the number of components each license applies to, and each license's family (Permissive, Restrictive Third Party Proprietary, Reciprocal, etc.). Click on a license's name to view License Details, including a list of components that use the license. |
Tests tab
View tests run on the project.
 |
|
| Table fields |
After you open a SAST & SCA project, Use SAST, SCA, and External Analysis tabs to the left of the table to view different types of tests. The DAST tab opens for DAST projects.
Select a test ID to see:
|
Branches tab
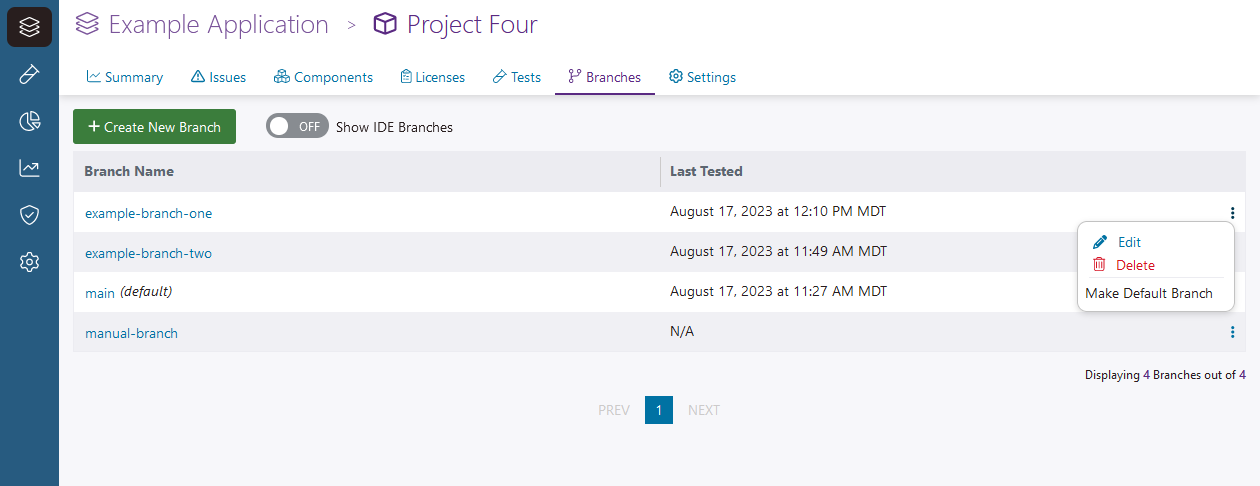
View, and manage a SAST & SCA project's branches.
 |
|
| + Create New Branch | Add a branch to the project. Note: If you integrate a SCM repository, your default branch in your repository will become you default branch in your Polaris project. To test other branches in your SCM repository, you need to import them. See Add a branch to a project. |
| Show IDE Branches | By default, branches you test with Code Sight (from your IDE) are hidden. Use this toggle to show them. |
| Table fields |
Lists all the branches in the SAST & SCA project. Here, you can see:
Click a branch name to modify the branch's settings, including:
|
DAST Profiles tab
View, and manage a DAST project's profile.
 |
|
| Table fields |
Lists the profile in the DAST project. Here, you can see:
Select a profile name to modify it's settings, including:
|
Settings tab
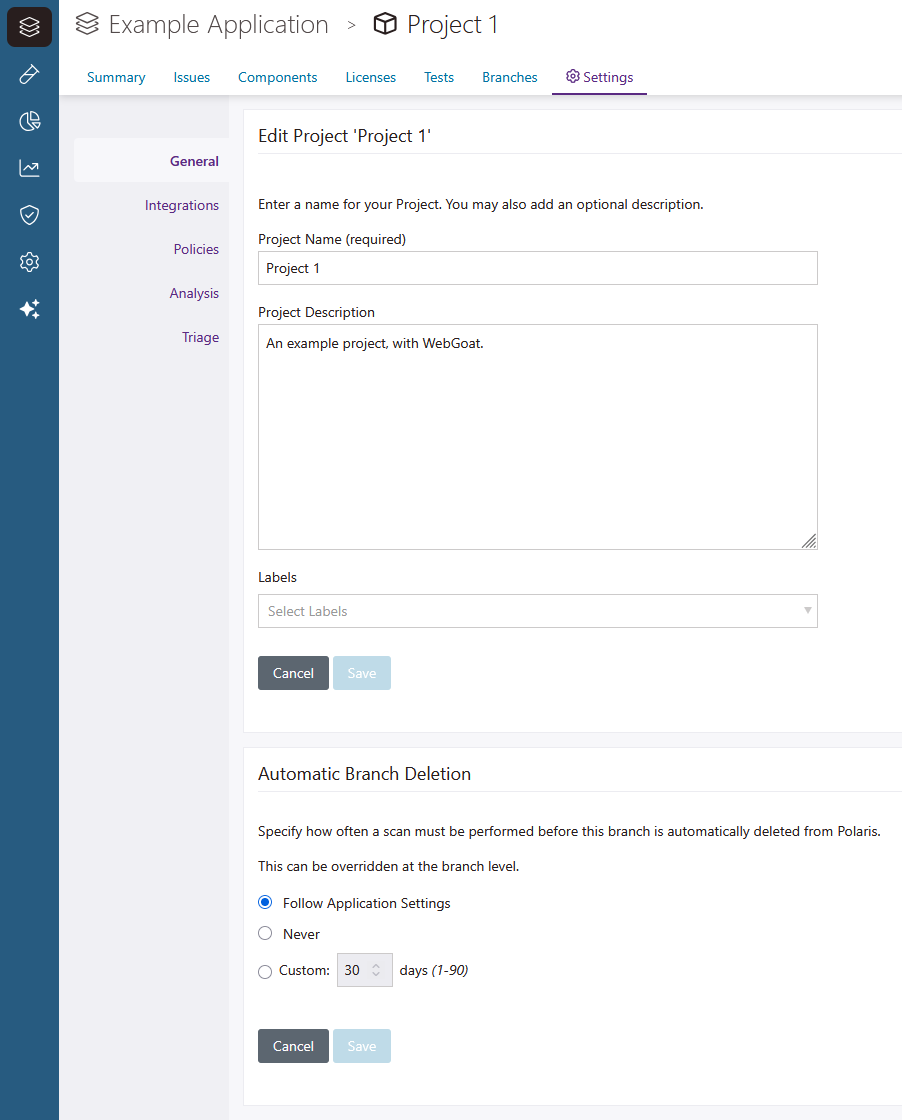
Manage settings for projects.
 |
|
| General | Edit the Project Name and Project Description. Apply or remove labels. Change the project's automatic branch deletion setting. |
| Integrations | Set up a Source Code Management (SCM) repository integration, or issue tracking integration for the project. See Connect a Polaris project to a repository in your SCM and Issue tracking integrations for more information. |
| Policies | View project policies and add an existing policy to the project. |
| Analysis | Manage a project's file and folder exclusion rules, and customize event-based test automation for your application (if part of an onboarded SCM repositories). See Event-Based Test Automation in Polaris for SCM Integrations for more information. |
| Triage | Manage a project's approval workflow. See Set up triage approval workflows for more information. |
 | Dev Portal